


Background
and Methodology
From degradation to regeneration: mapping the future of food, land, and investment.
Land degradation refers to the decline or loss of the land's biological or economic productivity. It is largely driven by human activities, intensified by natural processes, and closely linked to climate change and biodiversity loss. Food systems have been at the center of this challenge. While they are a primary cause of land degradation, their own capacity to produce healthy and nutritious food is also undermined by this deterioration. Within this context, pastureland is fundamental to food security as it provides the forage that sustains livestock. At the system level, well managed grasslands buffer drought and climate variability, maintain soil carbon and offer water regulation that steadies fodder availability. Conversely, widespread pasture degradation erodes productivity and resilience.
By implementing a comprehensive set of solutions across food systems, we can shift them from being a major driver of land degradation to becoming a key catalyst for restoration and recovery. The RAIZ Mapping Tool, developed by the G20 Global Land Initiative Coordination Office of the UN Convention to Combat Desertification (UNCCD) with technical support from the Food and Agriculture Organization (FAO), the Food and Land Use Coalition (FOLU), and the Alliance of Bioversity International and CIAT (part of CGIAR), is designed to enable this shift. The tool provides essential data to a wide range of stakeholders including investors, policymakers, NGOs and project developers, helping them swiftly and accurately identify areas with the greatest potential for productive restoration. The current tool is a preliminary, exploratory analysis developed through a consultative process with technical partners and informed by their expertise.
Objective of the RAIZ mapping tool
In the initial phase leading up to the UNFCCC's 30th Conference of the Parties (COP30) in Belém, Brazil, the mapping tool identifies degraded cropland and pastureland, using grassland and shrubland as proxies for pastureland. It presents a global heatmap that highlights regions with the highest concentrations of degraded pastureland and cropland. Building on this preliminary work, the focus following COP30 will shift to exploring and prototyping functionalities, such as mapping priority restoration areas based on socioeconomic and biophysical indicators to maximize impact and investment benefits.
Methodology
The platform is developed using a suite of global datasets to quantify and visualize the extent of cropland and pastureland degradation. It integrates multiple supporting layers that capture key biophysical and socioeconomic attributes, providing a comprehensive spatial understanding of land conditions. The maps presented within the platform primarily indicate areas where land degradation is most prevalent, based on the underlying analytical parameters.
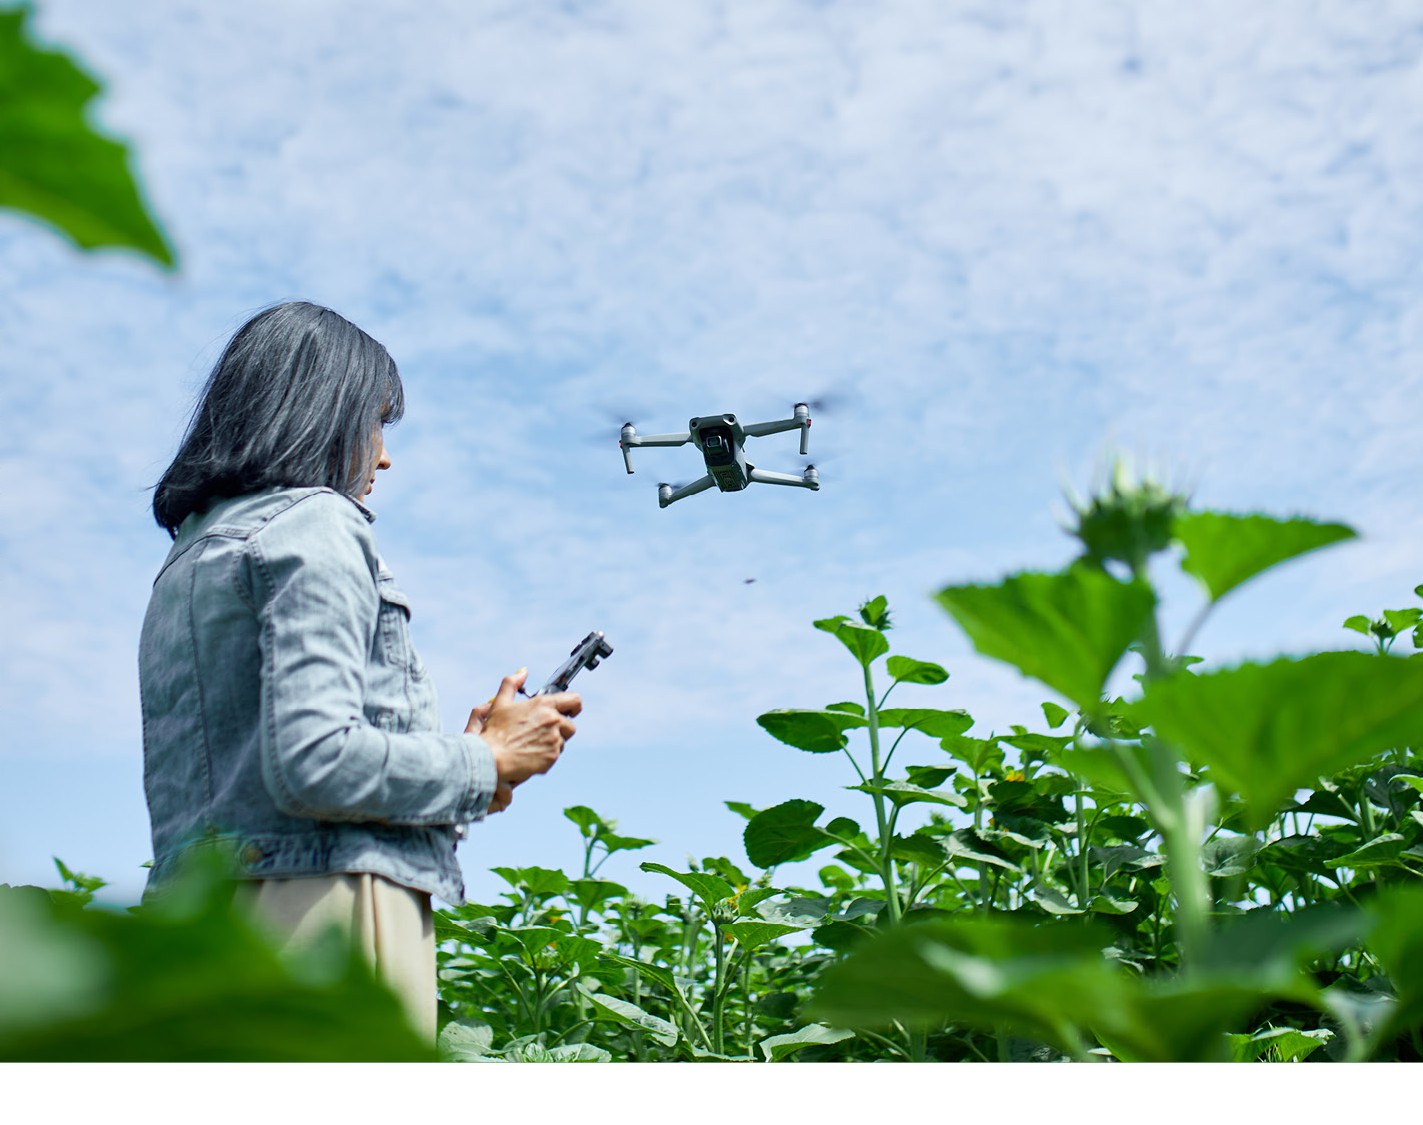
How the vulnerability maps are built
Indicators are organised into dimensions and grouped under pillars. Weights are set objectively with AHP and ANP, then every layer is modeled in ArcGIS and QGIS Model Builder to produce each country's vulnerability and adaptive capacity maps.
Structure
Indicators are grouped into dimensions, then organised under pillars.
Weight
AHP and ANP set objective weights at the indicator, dimension and pillar levels.
Model
ArcGIS and QGIS Model Builder combine the weighted layers into a single index.
Map
Vulnerability and adaptive capacity maps are produced for each country.
The input layers behind each indicator
SDG 15.3.1 shows the status of land (from degraded to improved) at pixel level over the period 2001 to 2015. The dataset is generated using the Trends.Earth model, following the UN metadata guideline for the SDG. To assess the area degraded, the indicator draws on three sub indicators — vegetation productivity, land cover, and soil organic carbon. The layer is compiled by UNEP GRID Geneva; UNCCD is the custodian of SDG 15.3.1.
Accurate measurements of global cropland extent are needed to monitor the sustainability of agriculture at all scales. This map of agreement and disagreement was produced by consolidating information at pixel level from six high resolution maps (10 to 30m). The input datasets represent the most advanced land cover and thematic layers available today for cropland area extent circa 2020, as described in the pre print "Measuring the world's cropland area".
Land cover classes from the Global Agro-Ecological Zoning (GAEZ v5) — grassland, shrub covered areas, shrub or herbaceous regularly flooded, and lichen and mosses — were selected to represent the distribution of grassland and shrubland. The same methodology is applied in the forthcoming FAO report on the Status of the World's Land and Water Resources for Food and Agriculture (SOLAW 2025). The RAIZ tool uses SOLAW's approach, where the combined share of grassland and shrubland within each cell is dominant, defined as having the highest proportional share and exceeding a 50 percent coverage threshold. The resulting layer represents a proxy for the extent of permanent meadows and pastures (FAO, 2025).
The Global Soil Organic Carbon Map (GSOCmap) by FAO allows the estimation of SOC stock from 0 to 30 cm. It represents the first ever global soil organic carbon assessment produced through a participatory approach in which countries developed their capacities and compiled all available soil information at national level. Values are in tonnes per hectare.
The GHS POP dataset represents the spatial distribution of the human population, expressed as the number of people per grid cell. Population data are derived from global census information harmonized by CIESIN for the Gridded Population of the World, version 4.11 (GPWv411), and disaggregated to grid cells using the distribution, classification and density of built up areas mapped in the GHSL global layers.
The CHIRPS precipitation anomaly is the difference between a specific period's rainfall and its historical average, calculated using the CHIRPS dataset.
Active fire density is based on the MODIS Collection 6 Active Fire Product (MCD14ML). The density of fires is reported as the count of fires per km² within pixels of 0.1 decimal degree (pixel dimension varies from about 20 km² at the poles to 122 km² at the equator). Only location points described as "presumed vegetation fire" in the attributes are included in the frequency calculation.
How the layers combine
The Global Land Degradation (SDG 15.3.1) and Global Cropland Agreement layers are used together to identify degraded cropland; SDG 15.3.1 and GAEZ are combined to identify degraded pastureland. A heatmap highlights the density of degraded areas — high density signals the continuity of degradation across the landscape, which translates into greater potential for efficient, large scale restoration. These heatmaps reveal concentration and potential continuity, but do not currently indicate the severity of degradation itself.
Strengths and limitations
The tool relies on global datasets that often miss the complexity and diversity of agricultural landscapes, particularly in low and middle income countries. Limited contextual information and coarse spatial resolution reduce overall quality and accuracy. Because training data and methods are frequently biased toward Global North contexts, they do not always transfer well to local conditions or informal practices, and reliability is further limited by scarce ground truth data for training and validation.
Understanding cropland extent, management and seasonal dynamics requires high resolution, locally calibrated data and context specific knowledge. This tool serves as an indicative resource for identifying areas of degradation, but it should not be considered a substitute for on the ground assessment or validation.
References
- 1.UNCCD (1994). Article 1 of the Convention Text. unccd.int
- 2.UNCCD and WOCAT (2024). The Land Story. UN Convention to Combat Desertification, Bonn. unccd.int
- 3.Ahmed, F. et al. (2025) 'Exploring the linkages between land degradation and food insecurity', Asia Pacific Journal of Rural Development, 35(1), pp. 71–90. doi:10.1177/10185291241307272
- 4.IPCC (2019). Climate Change and Land: an IPCC Special Report on climate change, desertification, land degradation, sustainable land management, food security, and greenhouse gas fluxes in terrestrial ecosystems. Shukla, P.R. et al. (eds.). In press.
See the methodology in action
Explore the country assessments for Mauritania and Mongolia.